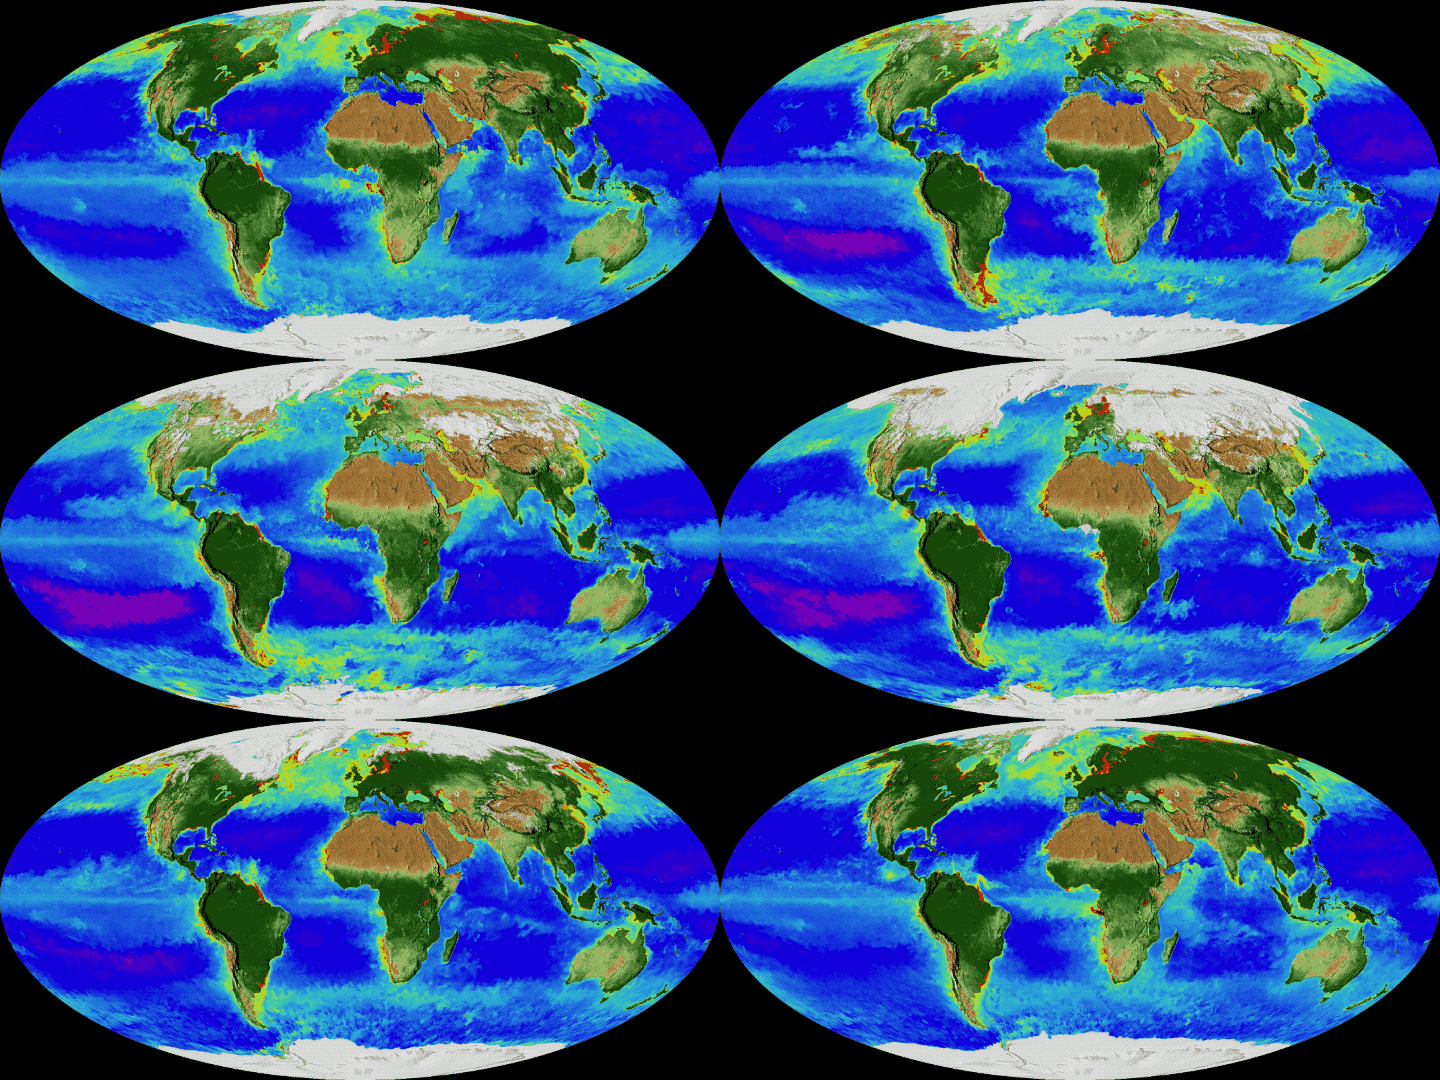
A new NASA visualization shows 20 years of continuous observations of plant life on land and at the ocean’s surface, from September 1997 to September 2017. On land, vegetation appears on a scale from brown (low vegetation) to dark green (lots of vegetation); at the ocean surface, phytoplankton are indicated on a scale from purple (low) to yellow (high). This visualization was created with data from satellites including SeaWiFS, and instruments including the NASA/NOAA Visible Infrared Imaging Radiometer Suite and the Moderate Resolution Imaging Spectroradiometer. Credits: NASA
Lista de alun@s por turma para organizar grupos e turnos - já inclui trocas de dia 19 (PLs de fitoplâncton):